 hxScout
Overview
hxScout helps you identify hot spots in your application as well as in frameworks and libraries you use. This allows you to spend your optimization effort wisely for the highest ROI.
Terminology: In this document, your application is sometimes referred to as the application under test, or AUT. The AUT includes the hxtelemetry library which sends telemetry data to hxScout over the network (often to the same computer, but optionally from another device to your computer). hxScout displays the telemetry data.
Warning: hxScout and hxtelemetry are provided as-is without any warranty for fitness for any particular purpose, and without guarantee that is in beta. Some features may not work or may not be fully implemented. Feel free to file bug reports or feature requests on github.
Using hxScout
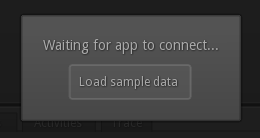
 To quickly evaluate hxScout, it comes preloaded with a sample session that you can browse. Start hxScout and click the "Load sample data" button.
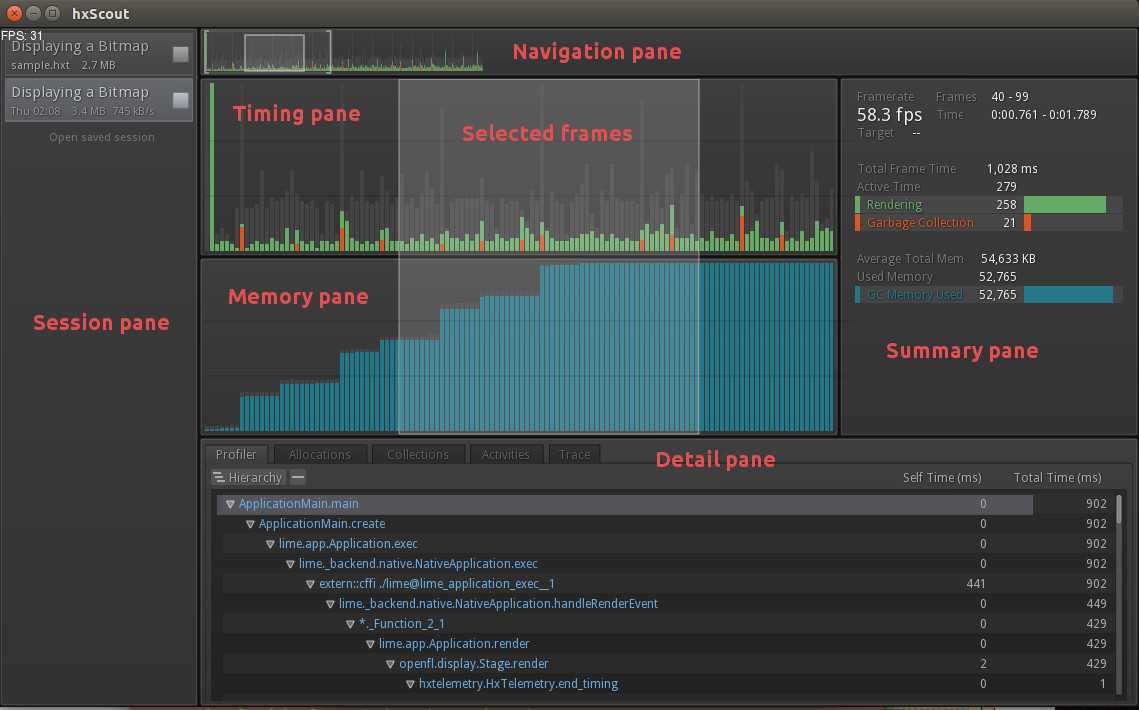
This will bring up the main interface with which you can explore the data in the telemetry session.
Interface Overview
The interface of hxScout is split into six panes:

- The session pane shows telemetry sessions with the active session highlighted. Click on a session to make it active. All other panes show information of the currently active session.
- The navigation pane shows a miniature view of the timing pane. Click and drag in the navigation pane to adjust the frames in view in the timing and memory panes.
- The timing pane and memory pane each display a bar graph, one column per frame. The timing pane shows different activities in different colors, depicting how long the AUT spent on each activity. The memory pane shows how much memory is in use by the AUT.
Click and drag in the timing or memory pane to select a region of frames. Information about the selected frames in displayed in the summary and detail panes. - The summary pane shows stats about the selected frames, including frame numbers and time, and aggregate timing and memory information.
- The detail pane shows detailed information about the selected frames. This pane is split into five tabs:
- The profiler tab displays a hierarchical table of stacks, detailing how long the AUT spent at various locations in the code during the selected frames, and where that code was called from. Stacks are presented top-down, so the application main entry point is at the root, with each function call indented and subsequently containing the functions they call. Time is reported in milliseconds, including self time (time spent in the function itself) and total time (self time plus time spent in child functions.)
The list can be sorted by self time or total time. It can be fully expanded or collapsed. Using the hierarchy button, the hierarchy can be flattened - this affects sorting. e.g. By flattening and sorting by self time, one can quickly find where the majority of time was spent.
The profiler can be disabled in the hxtelemetry configuration, in which case this tab is empty. - The allocations tab displays a hierarchical table of objects allocated during the selected frames. Allocations are presented bottom-up, displaying first the object type, then the function which instantiated the object, then the function which called that function, and so on up until the application main entry point. Object count and total memory size are reported, and you can sort by either.
Allocation tracking can be disabled in the hxtelemetry configuration, in which case this tab (and the deallocations tab) are empty. - The deallocations tab displays a hierarchical table of objects collected by the garbage collector during the selected frames. Deallocations are presented in the same manner as allocations. The stacks show where the objects were allocated (as objects are not deallocated specifically from any stack location.)
- The activities tab displays a hierarchical table of activities during the selected frames. Activities are similar to the profiler, except whereas the profiler display stacks measured by sampling the call stack, the activities display displays activities specifically instrumented by your code and/or a framework (like OpenFL.) The OpenFL framework, for example, instruments event handlers and the rendering calls.
- The trace tab displays the trace output that was generated by the AUT during the selected frames.
- The profiler tab displays a hierarchical table of stacks, detailing how long the AUT spent at various locations in the code during the selected frames, and where that code was called from. Stacks are presented top-down, so the application main entry point is at the root, with each function call indented and subsequently containing the functions they call. Time is reported in milliseconds, including self time (time spent in the function itself) and total time (self time plus time spent in child functions.)
Keyboard shortcuts
Coming soon...Investigating with the Profiler
Coming soon...Investigating Allocations and Garbage Collection
Coming soon...Profiling Your Haxe C++ App
By including the hxtelemetry library, your Haxe C++ application sends telemetry data to hxScout over the network. This allows profiling of local desktop apps or those on devices like mobiles or consoles.
Environment Setup
First, install the hxtelemetry library with haxelib:
haxelib install hxtelemetry
You may also need to update hxcpp. Starting with hxcpp 3.2.171 (available on haxelib), telemetry support is built into hxcpp. Check your version of hxcpp with haxelib list hxcpp. If necessary, update hxcpp using:
haxelib update hxcpp
Telemetry Setup
Profiling hxcpp apps does not require an application framework, but some frameworks expedite telemetry setup.OpenFL 3.1.1 or newer
If your app is using OpenFL 3.1.1 or newer, enabling telemetry is as easy as adding -Dtelemetry to your openfl / lime commandline. OpenFL automatically includes the hxlelemetry library and sets up telemetry.
Mobile devices or consoles: To profile an application running on another device, you need to specify the IP address of the computer running hxScout in your project.xml file:
<config:hxtelemetry host="192.168.1.100" allocations="true" />
Snow/Luxe
Stefan Bachmann posted an excellent write-up about using hxScout and hxtelemetry with Snow/Luxe over at snowkit.org: http://snowkit.org/2015/07/31/using-hxscout-with-snowluxe/
Other / No Framework
To generate telemetry data, applications under test must:- Include the hxtelemetry library, e.g. -cp <path/to/hxtelemetry>
- Set two compiler defines, -D HXCPP_STACK_TRACE -D HXCPP_TELEMETRY
- Instantiate the telemetry object: var hxt = new HxTelemetry();
- Call hxt.advance_frame() each frame. (If your application doesn't have "frames" just call advance_frame at some regular interval.)
First launch hxScout, then launch your application. If telemetry data doesn't start showing up, verify your app was built with the proper libs and flags, and that network communication over socket port 7934 is open (and not blocked by a firewall.)
Many example apps are provided in the hxtelemetry/test directory. The HxTelemetry object can be configured as shown in some examples.
Multi-threading note: hxtelemetry is designed to work with multi-threaded apps. Right now the schema is: each thread instantiates an hxtelemetry object and calls advance_frame, resulting in separate sessions in hxScout. See my multi-threaded test for example. Later I'd like to investigate a schema where the data is displayed in the same hxScout session.
Framework Integration
If you're developing an application framework (e.g. OpenFL, Snow, heaps, etc) and want an easy, 1-switch telemetry setup for your users, shoot me a tweet.
Adobe Scout, Adobe® AIR®, and Adobe® Flash® are either registered trademarks or trademarks of Adobe Systems Incorporated in the United States and/or other countries.
hxScout is not affiliated with Adobe Systems Incorporated. hxScout is copyright Jeff Ward, all right reserved.
Use this software (hxscout.com, hxScout, and hxtelemetry) is entirely at your own risk. No warranty is expressed or implied. Not guaranteed for fitness for any purpose. Jeff Ward is not liable for damages of any kind that may result from the use (or inability to use) this software. This software may make use of analytics that track your use of the software. Use of the software constitutes acceptance of these terms. Terms are subject to change.